Glossary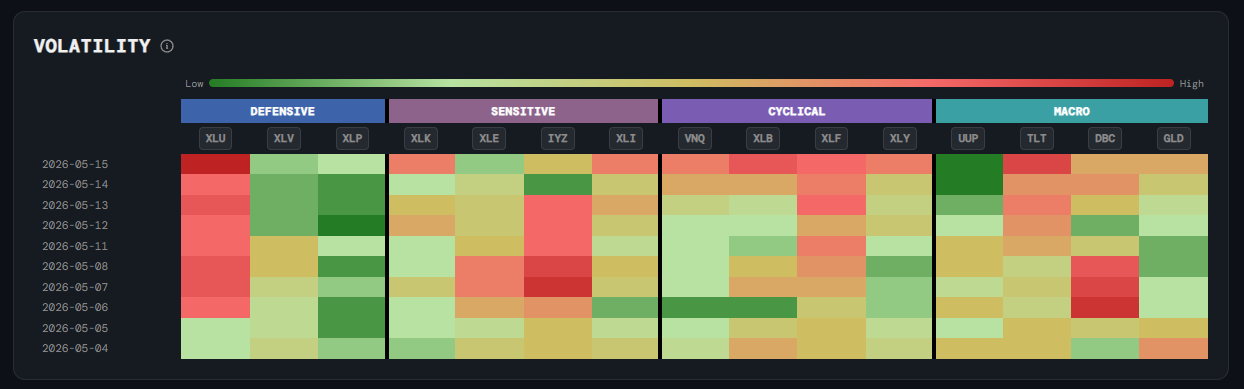
Macro
Volatility Heatmap
What it is
A grid of cells showing the current realised volatility of each major sector ETF and key macro instruments, colour-coded from calm (dark green) to highly stressed (dark red) based on where current volatility ranks relative to its own history.
How to read it
Each cell is a percentile rank of that ETF's realised volatility — not the raw number. Green means volatility is unusually low right now; yellow is around the median; red means the ETF is unusually volatile relative to its own history. ETFs are grouped into four categories:
- Defensive (XLU, XLV, XLP) — Utilities, Healthcare, Consumer Staples — sectors that typically have lower volatility and hold up in downturns.
- Sensitive (XLK, XLE, IYZ, XLI) — Technology, Energy, Communications, Industrials — more exposed to economic cycles.
- Cyclical (VNQ, XLB, XLF, XLY) — Real Estate, Materials, Financials, Consumer Discretionary — most sensitive to economic growth.
- Macro (UUP, TLT, DBC, GLD) — US Dollar, Bonds, Commodities, Gold — cross-asset instruments that signal broader market stress or rotation.
Why it matters
Volatility tells you how much uncertainty is priced into each part of the market. When cyclical sectors turn red while defensives stay green, the market is pricing stress into growth-sensitive areas. When macro instruments like bonds or gold spike, it often signals a flight to safety. Spotting which pockets of the market are getting more volatile — before the price move happens — helps you judge conviction and risk.
Platform access
See this live on the platform
Sign in to access live charts, weekly signals, and the full Weekly Windup report.