Glossary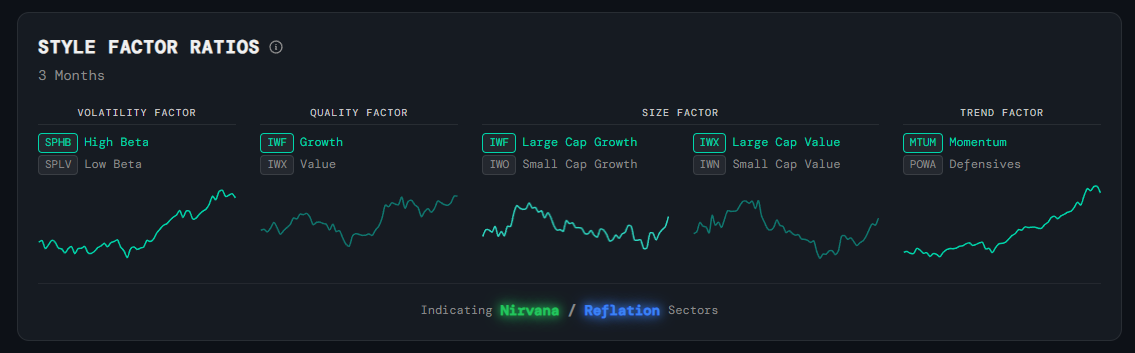
Macro
Style Factor Ratios
What it is
A set of five ratio charts (Volatility, Quality, Size ×2, Trend) that each compare two competing investment styles — e.g. High Beta vs Low Beta, Growth vs Value. Together they vote on whether the market is currently favouring a Nirvana/Reflation (NR) or Inflation/Deflation (ID) environment.
How to read it
Each chart shows the ratio of the two styles over time. When the line is trending up, the numerator (top ticker, highlighted in teal) is outperforming. The "Indicating" label at the bottom shows the majority vote across all five charts — NR, ID, or Mixed.
- Volatility Factor (SPHB / SPLV) — High Beta vs Low Beta. Rising = investors chasing risk, typical of NR regimes.
- Quality Factor (IWF / IWX) — Growth vs Value. Rising = growth stocks leading, more common in NR.
- Size Factor (IWF / IWO and IWX / IWN) — Large Cap vs Small Cap (both growth and value). Large Cap dominance signals flight to quality — more ID. Small Cap dominance signals risk appetite — more NR.
- Trend Factor (MTUM / POWA) — Momentum vs Defensives. Rising = trend followers winning, typical of NR.
Why it matters
Style factor rotation is one of the earliest signals of a regime shift. When risk-on factors start underperforming their defensive counterparts, it often precedes a move toward ID regimes — and vice versa.
Platform access
See this live on the platform
Sign in to access live charts, weekly signals, and the full Weekly Windup report.