Glossary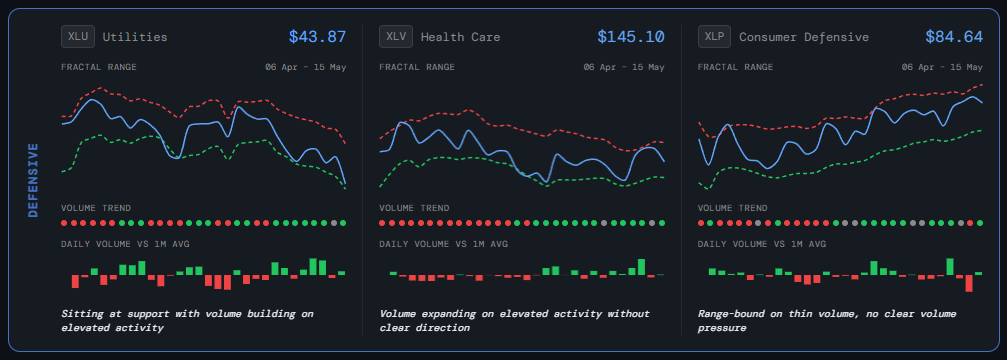
Sectors
Sector Volume Flows
What it is
Individual mini-cards for each major sector ETF (XLK, XLE, XLV, etc.) showing price range, volume trend, and daily vs monthly volume bars.
How to read it
- Price fractal range — Shows where price sits within its recent structural range — near support (fractal low) or resistance (fractal high).
- Volume trend dots — Track whether volume has been expanding or contracting over recent sessions.
- Daily vs monthly bars — Compares today's volume to the monthly average — spikes above the average on up days are constructive; spikes on down days are cautionary.
Why it matters
Volume analysis at the sector level gives you conviction behind price moves. A sector breaking out on low volume is far less reliable than one with expanding volume confirming the move.
Platform access
See this live on the platform
Sign in to access live charts, weekly signals, and the full Weekly Windup report.