Glossary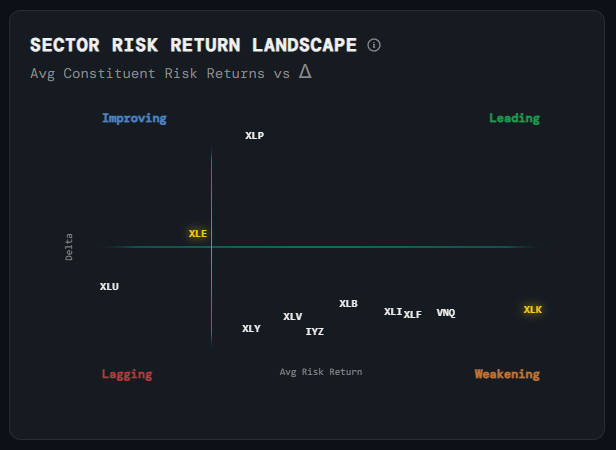
Sectors
Sector Risk Return Landscape
What it is
A scatter plot showing each sector ETF's average constituent Sharpe ratio (x-axis) against its rate of change or delta (y-axis). The Sharpe ratio measures risk-adjusted returns — reward per unit of risk taken.
How to read it
Four quadrants describe the risk/return landscape:
- Leading (top-right) — Strong Sharpe and improving — best risk-adjusted momentum.
- Weakening (bottom-right) — Good Sharpe but deteriorating — watch for rotation out.
- Improving (bottom-left) — Sharpe recovering from low levels — turnaround candidates.
- Lagging (top-left) — Weak and deteriorating risk/reward — typically avoids.
Why it matters
Risk-adjusted thinking is essential for sector rotation. A sector posting high returns with very high risk may not be worth chasing. This chart surfaces which sectors are genuinely efficient on a risk/return basis versus those riding volatility.
Platform access
See this live on the platform
Sign in to access live charts, weekly signals, and the full Weekly Windup report.