Glossary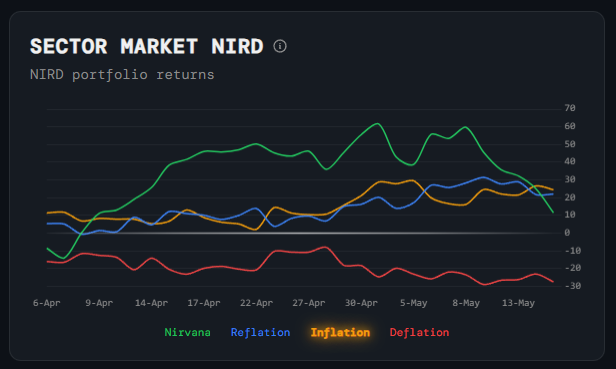
Sectors
Sector Market NIRD
What it is
A multi-line chart tracking the cumulative returns of the four NIRD regime portfolios (Nirvana, Reflation, Inflation, Deflation) over time.
How to read it
Each line represents how a portfolio long the sectors favoured by that regime, and short the ones that aren't, has performed. When a line is rising relative to the others, that regime's sectors are currently leading the market.
Why it matters
This is the performance validation layer — it shows whether the regime identified by other signals is actually being reflected in sector price action. If the Nirvana line is breaking out, money is rotating into tech, financials, and industrials in real time.
Platform access
See this live on the platform
Sign in to access live charts, weekly signals, and the full Weekly Windup report.