Sector ETF Drivers
What it is
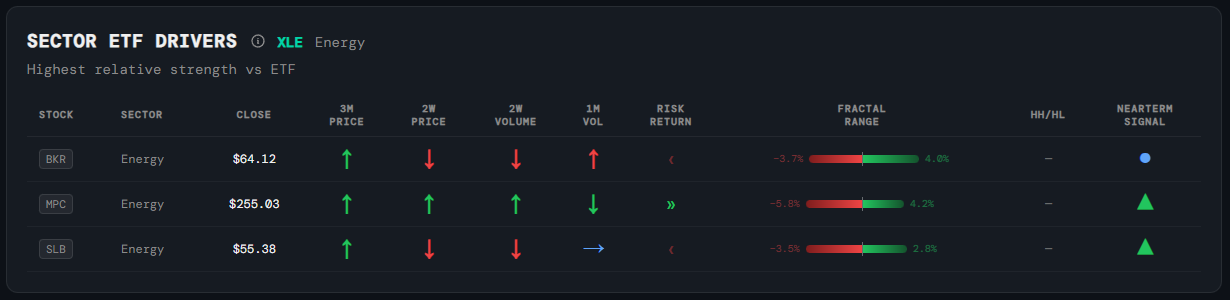
A data table showing the top 3 stocks currently driving a selected sector ETF by relative strength vs the ETF itself.
How to read it
Each row shows a stock's key metrics — close price, signal, momentum, volume trend — alongside a mini price chart. Expandable rows show additional detail and recent news links. The stocks shown are those most responsible for the ETF's current trajectory.
Why it matters
ETF returns are rarely evenly distributed. A handful of stocks typically drive most of the move — either up or down. Identifying those drivers helps you understand whether a sector's strength is broad-based or concentrated, and surfaces individual stock ideas with strong sector backing.
Platform access
See this live on the platform
Sign in to access live charts, weekly signals, and the full Weekly Windup report.