Sector Correlation
What it is
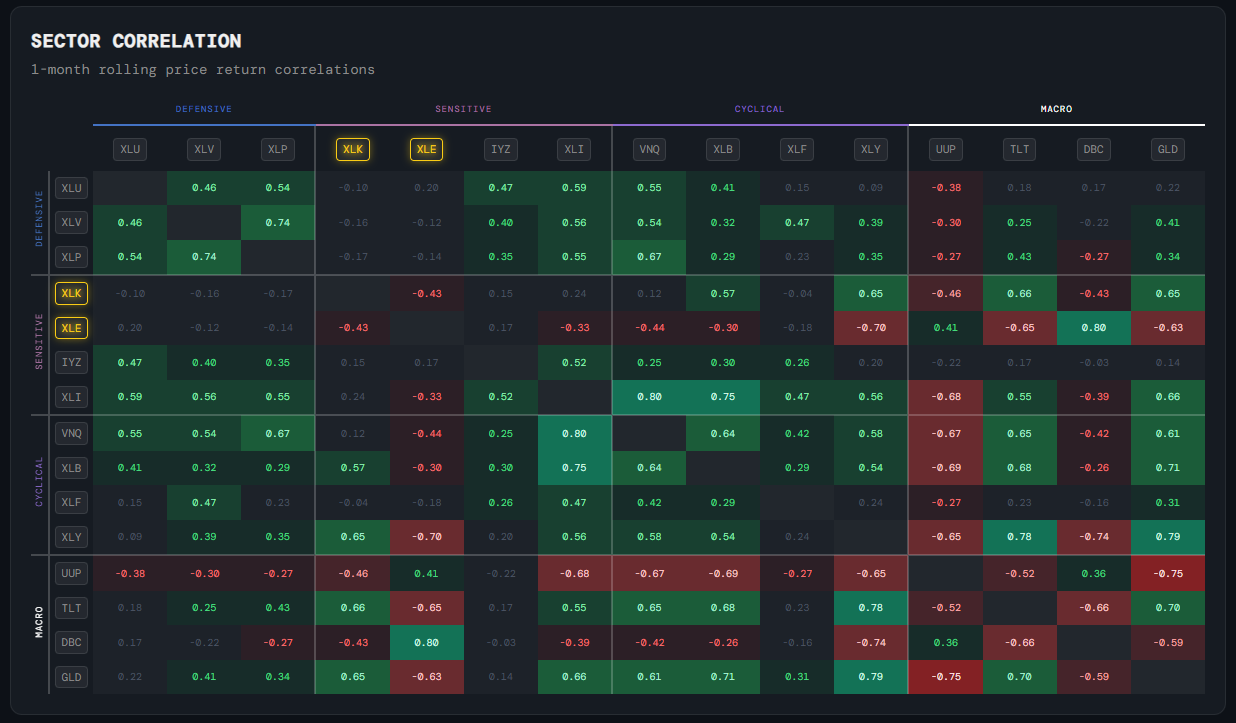
A colour-coded matrix showing rolling 1-month price return correlations between all major sector ETFs and key macro instruments.
How to read it
Green cells = sectors moving together (positive correlation). Red cells = sectors moving in opposite directions (negative correlation). The darker the colour, the stronger the relationship. A sector showing low correlation to everything else may be driven by its own idiosyncratic factors.
Why it matters
In concentrated moves — such as a broad risk-off selloff — correlations spike toward 1 and everything falls together. Watching correlation helps you understand whether apparent sector diversity in a portfolio actually provides protection, or whether holdings are all moving as one.
Platform access
See this live on the platform
Sign in to access live charts, weekly signals, and the full Weekly Windup report.