Glossary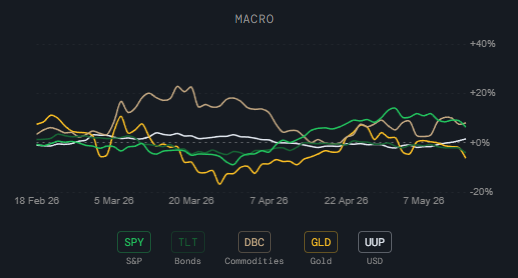
Macro
Rolling Returns
What it is
A set of line charts showing the rolling 30-day percentage returns for a range of asset groups, sector ETFs, and style factor ETFs over time.
How to read it
Each line tracks how much a given ETF or asset has returned over a rolling 30-day window. When a line is above zero it has gained over that window; below zero it has lost.
- Macro — SPY (S&P 500), TLT (Bonds), DBC (Commodities), GLD (Gold), UUP (USD) — the big cross-asset picture.
- Sectors — Defensive, Sensitive, Cyclical, and Macro sector group aggregates — shows which broad sector group is winning or losing.
- Beta — SPHB (High Beta), SPLV (Low Beta), SPY — tells you whether the market is rewarding risk-on or risk-off positioning.
- Value — Small Cap Value (IWN), Mid Cap Value (IJJ), Large Cap Value (IWX) — tracks the value factor across market caps.
- Safety — MTUM (Momentum), QUAL (Quality), SPHD (High Dividend), POWA (Defensives) — shows which safety-oriented strategies are outperforming.
- Growth — Small Cap Growth (IWO), Mid Cap Growth (IJH), Large Cap Growth (IWF), Mega Cap (OEF) — tracks growth across market caps.
Why it matters
The rolling return view shows the actual market verdict — not what signals predict, but what has happened. When the Macro chart shows bonds and gold outperforming stocks, it confirms a risk-off environment. When the Style charts show low beta and value outperforming, it confirms a flight to safety. This is the performance validation layer that shows whether the regime signals are actually being reflected in returns.
Platform access
See this live on the platform
Sign in to access live charts, weekly signals, and the full Weekly Windup report.