Glossary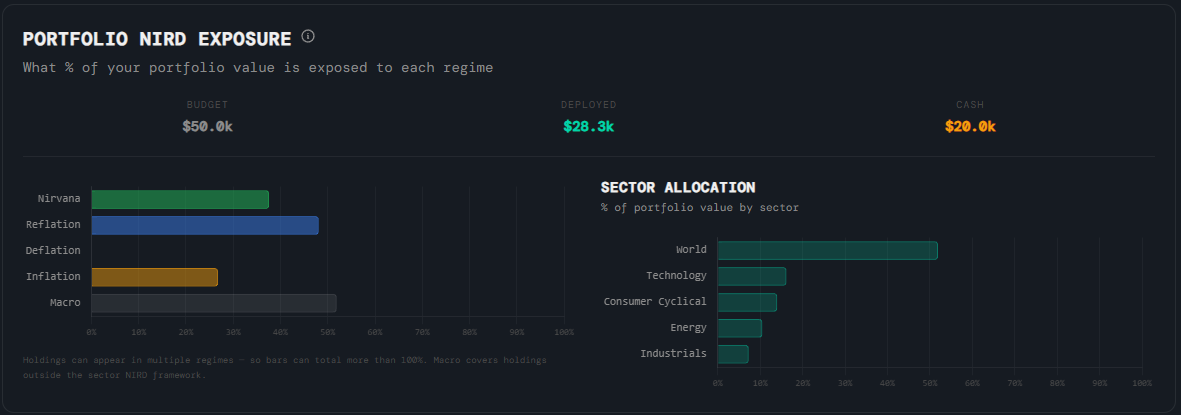
Watchlists
Portfolio Architect
What it is
The Portfolio Architect is a step-by-step guided tool that walks you through the platform's macro, sector, and ideas analysis, collects your signal-driven picks into three buckets — Macro, Sectors, and Companies — and then sizes each position based on your budget and the current NIRD regime. The resulting portfolio is tracked in your Portfolio Watchlist, where you can see your holdings alongside daily price and signal data, and recalculate sizing whenever the regime changes.
How to read it
Positions are sized using a three-layer framework:
- Layer 1 — Bucket weights — Your total budget is split across three buckets: Macro (50%), Sectors (35%), Companies (15%). If a bucket is empty, its weight is redistributed proportionally to the others.
- Layer 2 — Gross ceiling — The NIRD confluence between your Macro and Sector regime readings sets a deployment ceiling — the maximum fraction of your budget that gets invested. When both reads are risk-on and agree (e.g. both Nirvana), 100% is deployed. When they diverge or both read risk-off, the ceiling drops to preserve capital as cash. The ceiling ranges from 50% (maximum caution) to 100% (full deployment).
- Layer 3 — Sector regime multiplier — Within the Sector bucket, each ETF is weighted by how well it aligns with the sector NIRD. ETFs on the long list for the current regime get full weight (×1.0). ETFs on the short list get half weight (×0.5). Everything else gets a neutral weight (×0.75). Macro and Company picks are equal-weighted — regime alignment is not applied there.
- Recalculate — When the regime changes, update the Macro and Sector NIRD selectors on the Portfolio card and hit Recalculate. Share quantities are updated instantly using latest prices and the new regime weights — no need to rebuild from scratch.
- NIRD Exposure chart — Below the holdings table, the NIRD Exposure chart shows what percentage of your total portfolio value is exposed to each regime based on current prices and quantities. Because a stock can belong to sectors that appear in multiple regimes, bars can sum to more than 100%. The Macro bar covers holdings outside the sector NIRD framework (currencies, bonds, style-factor ETFs).
- Sector Allocation chart — Sits alongside the NIRD chart and shows how your portfolio value is distributed across the sectors, giving you a second lens on concentration risk.
Why it matters
Most portfolio tools track what you own. The Portfolio Architect connects what you own to why you own it — each position has a regime rationale, a bucket, and a size derived from the signals on the platform. When the regime shifts, the Recalculate button reprices the whole portfolio in seconds, so you always know whether your sizing still makes sense.
Platform access
See this live on the platform
Sign in to access live charts, weekly signals, and the full Weekly Windup report.