Glossary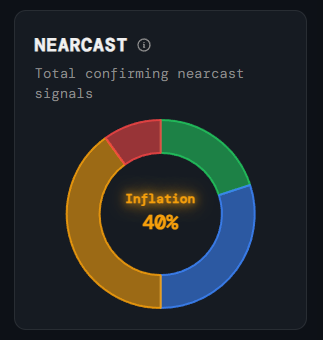
Outlook
Nearcast
What it is
A doughnut chart showing the current probability weighting across all four NIRD regimes, derived from a basket of nearterm confirming signals.
How to read it
The largest segment represents the dominant regime. The percentage shown in the centre is the confidence level for that regime. A small or fragmented dominant segment means signals are conflicted; a large segment means strong confirmation.
Why it matters
While the NIRD scatter plot shows where you are historically, the Nearcast shows what the quantitative signals are heading toward — giving you a probability-weighted view of where the market is heading in the near term.
Platform access
See this live on the platform
Sign in to access live charts, weekly signals, and the full Weekly Windup report.