Macro Market NIRD
What it is
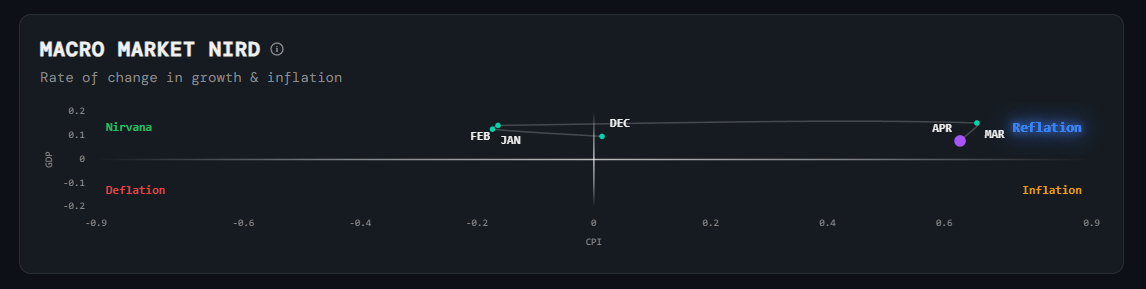
A 2D scatter plot that positions the economy within one of four regime quadrants — Nirvana, Inflation, Reflation, or Deflation — based on the direction of growth (GDP) and inflation (CPI).
How to read it
The x-axis represents inflation (rising right = higher inflation), the y-axis represents growth (rising up = stronger growth). Each dot is a time period. Where the most recent dot sits tells you which regime the economy is currently in, and the trail of dots shows how we got here.
Why it matters
Different asset classes and sectors perform very differently depending on which quadrant you're in. Knowing the current regime — and whether you're moving toward or away from it — helps you position into sectors that are historically rewarded in that environment.
Platform access
See this live on the platform
Sign in to access live charts, weekly signals, and the full Weekly Windup report.