Glossary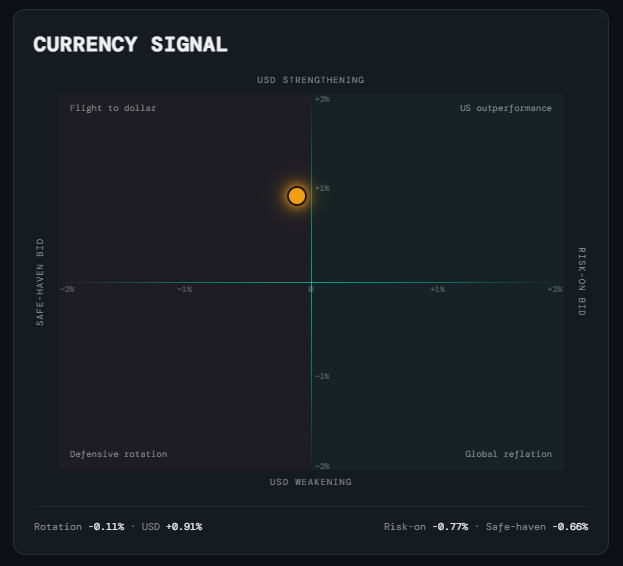
Weekly Windup
Currency Signal
What it is
A 2D quadrant chart that plots two independent pieces of currency market information simultaneously: risk appetite on the horizontal axis (are flows moving toward risk-on or safe-haven currencies?) and USD direction on the vertical axis (is the dollar strengthening or weakening?). It is built from monthly ETF returns and is explicitly not a NIRD signal — currency markets price relative macro conditions between economies rather than decomposing onto the growth/inflation axes the NIRD framework uses. Its role is confirmation, not regime calling.
How to read it
The dot's position on the chart encodes two readings at once. Its colour adds a third layer of interpretation:
- Horizontal axis — Risk appetite — Measures the return spread between the risk-on basket (FXA/AUD, FXC/CAD — commodity-exporting, high-beta currencies) and the safe-haven basket (FXY/JPY, FXF/CHF). Positive (dot to the right) means risk-on currencies are outperforming. Negative (dot to the left) means safe havens are leading. EUR and GBP are deliberately excluded: both are dominated by region-specific central bank and political factors that don't decompose onto a global risk axis.
- Vertical axis — USD direction — Measures the monthly return of UUP (the DXY proxy). Up means the dollar strengthened; down means it weakened. The interpretation of USD direction depends on context — a strong dollar in a growth regime signals US relative outperformance, while a strong dollar in a weak-growth regime signals risk-off flight to safety.
- Green dot — Risk-on — The risk-on basket outperformed safe havens by more than the 0.25% threshold, and USD is not the dominant driver. Currency flows support a growth-positive read.
- Red dot — Safe-haven — Safe-haven currencies led by more than 0.25%, and USD is not dominant. Currency flows are signalling defensive pressure.
- Amber dot — USD-Dominant — The USD's monthly move is larger than the spread between the two baskets. When this is the case, both baskets tend to move in the same direction (driven by the dollar) and the rotation signal is unreliable noise. The note at the bottom of the card explains the dollar story in plain language.
- Grey dot — Neutral — The differential between baskets is within ±0.25% and USD is not dominant. No decisive flow either way — confirmation is absent this month.
Why it matters
The Currency Signal does not tell you which NIRD regime you are in. What it tells you is whether currency markets are agreeing or disagreeing with the regime. When the rotation and USD signals align with the regime (e.g., risk-on currencies leading during a Nirvana/Reflation read), it adds conviction. When they contradict it (e.g., safe-haven bid during a supposed Reflation), it is worth investigating the tension. Treated as a cross-asset sanity check rather than a standalone signal, the Currency chart gives you a read on where global capital is actually flowing — not just where the models say it should be.
Platform access
See this live on the platform
Sign in to access live charts, weekly signals, and the full Weekly Windup report.