Glossary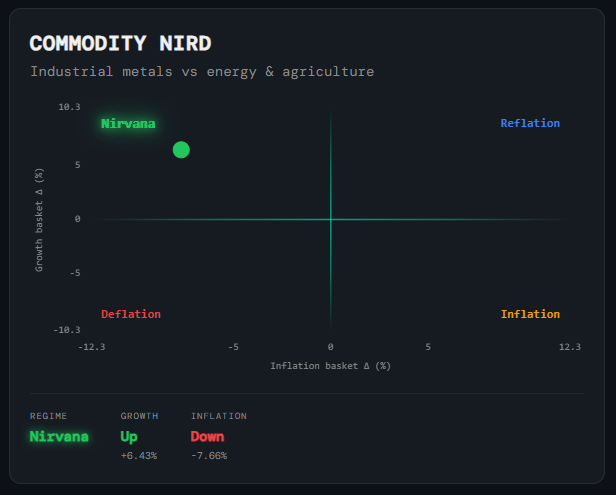
Macro
Commodity NIRD
What it is
A 2D scatter plot that applies the NIRD framework to commodity markets. Rather than using equity sector ETFs, it builds two baskets from commodity ETFs — a growth basket (industrial metals such as copper and steel, which respond to global manufacturing demand) and an inflation basket (energy and agricultural commodities, which drive consumer price pressures). The position of the single dot tells you which macro regime commodity markets are currently pricing.
How to read it
The horizontal axis is the monthly return of the inflation basket (energy and agriculture); the vertical axis is the monthly return of the growth basket (industrial metals). The dot lands in one of four quadrants:
- Nirvana (top-left) — Growth basket positive, inflation basket negative — metals up, energy and agriculture down. Industrial demand is healthy but price pressures are subdued. The most constructive commodity backdrop for equities.
- Reflation (top-right) — Both baskets positive — metals up, energy up. Commodities are broadly strong, reflecting an expanding economy with rising price pressure.
- Inflation (bottom-right) — Inflation basket positive, growth basket negative. Energy and food prices rising while metals weaken — cost-push inflation without the growth to support it. Historically adverse for equities.
- Deflation (bottom-left) — Both baskets negative. Broad commodity weakness signals slowing global demand and falling price pressure — the most risk-off quadrant.
- Regime scalars — Below the chart: Regime label (current quadrant), Growth state (Up/Down + monthly %) and Inflation state (Up/Down + monthly %). These let you see not just where the dot is but how far it is from the origin.
Why it matters
Commodities are a real-time referendum on global demand and supply conditions that equity markets can lag by weeks. When the Commodity NIRD is confirming the same quadrant as the Macro Market NIRD, it adds cross-asset conviction to the regime call. When they diverge — for example, equity signals pointing to Nirvana while commodities sit in Deflation — it is often an early warning that the equity regime call is fragile. The growth/inflation decomposition also helps separate demand-driven commodity moves (broadly positive) from supply-shock inflation moves (adverse for growth assets).
Platform access
See this live on the platform
Sign in to access live charts, weekly signals, and the full Weekly Windup report.