Glossary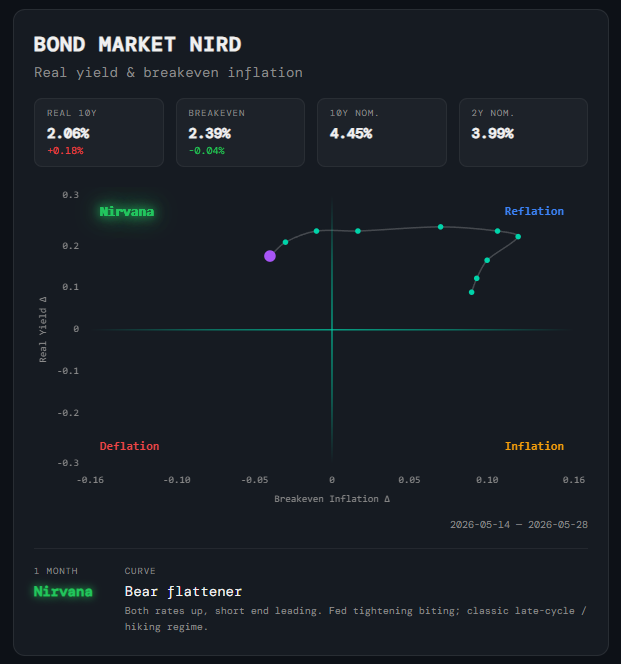
Macro
Bond Market NIRD
What it is
A 2D scatter plot that applies the NIRD framework to the US Treasury market. Instead of economic data, it reads growth and inflation expectations straight from bond prices: the 10-year real yield (the inflation-adjusted yield on TIPS) reflects the market's view of real growth, and the 10-year breakeven rate (the gap between nominal and real yields) reflects its view of future inflation. Each point is the one-month change in both, so the chart shows which way bond-market expectations are moving rather than their absolute level.
How to read it
The vertical axis is the change in the real yield (Real Yield Δ) and the horizontal axis is the change in breakeven inflation (Breakeven Inflation Δ). The trail shows the last 10 daily readings, with the latest point highlighted in purple; the quadrant it sits in glows:
- Nirvana (top-left) — Real yields rising, breakevens falling — the bond market is pricing stronger growth with easing inflation.
- Reflation (top-right) — Real yields and breakevens both rising — the market expects growth and inflation to pick up together.
- Inflation (bottom-right) — Breakevens rising while real yields fall — inflation expectations climbing without the growth to match.
- Deflation (bottom-left) — Real yields and breakevens both falling — the market is pricing slowing growth and fading inflation.
- Yield readouts — Above the chart: the current 10-year real yield and breakeven, each with its one-month change, plus the 10-year and 2-year nominal yields. Changes are red when yields are rising (bond prices falling) and green when they are falling.
- 1 Month and Curve — Below the chart: the bond market's current regime call, and the yield-curve regime — bear or bull, steepener or flattener — based on how the 10-year and 2-year yields are moving, with a short note on what that shape usually signals. A Curve confluence badge appears beside the title when the curve backs up the regime call.
Why it matters
The Treasury market is one of the deepest and most forward-looking markets in the world, and it reprices growth and inflation expectations every day — well before the GDP and CPI data behind the Macro Market NIRD is published. When the Bond Market NIRD sits in the same quadrant as the Macro Market NIRD, the regime call has cross-asset support. When they diverge — for example, macro data pointing to Nirvana while bonds are pricing Deflation — it is often an early warning that the macro picture is about to turn. The curve regime adds a sense of where you are in the cycle, from early-cycle easing to late-cycle tightening.
Platform access
See this live on the platform
Sign in to access live charts, weekly signals, and the full Weekly Windup report.