Glossary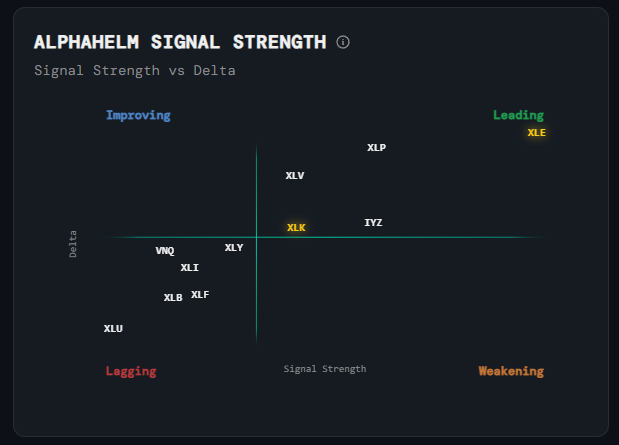
Sectors
AlphaHelm Signal Strength
What it is
A scatter plot comparing each sector ETF's signal strength (x-axis) against its rate of change or delta (y-axis). Signal strength is a composite of price movement, volume trend, volatility, and fractal range profiles.
How to read it
The further right a sector is, the stronger its current signal. The higher up it sits, the more that signal is accelerating. Top-right quadrant = strong and improving. Bottom-left = weak and deteriorating.
Why it matters
Signal strength alone doesn't tell you direction of travel. A sector with a strong but flat signal may be topping out. One with a weaker but rapidly improving signal may be early in a move. The delta axis surfaces that momentum.
Platform access
See this live on the platform
Sign in to access live charts, weekly signals, and the full Weekly Windup report.